Signal Detection in Pharmacovigilance: Identifying Safety Signals Earlier Through Automation and Advanced Analytics
A mid-sized pharmaceutical company detected a hepatotoxicity signal 11 weeks after the first case report arrived. By then, hundreds of additional patients had received prescriptions. Their quarterly review cycle, standard practice for signal detection, meant the pattern sat unexamined while their safety database accumulated cases.
This delay is not rare. Most organizations still run signal detection monthly or quarterly using manual processes and the Proportional Reporting Ratio (PRR) and Reporting Odds Ratio (ROR) methods developed in the 1990s. Meanwhile, automated systems powered by machine learning algorithms detect the same signals in days by analyzing patterns across multiple variables simultaneously.
Learn why manual methods delay detection, how automation accelerates it, what integration actually requires, and which implementation decisions determine success.
Why Traditional Signal Detection Methods Fall Short
For decades, pharmacovigilance teams have relied on two statistical methods: Proportional Reporting Ratio (PRR) and Reporting Odds Ratio (ROR). Both compare how often an adverse event gets reported for one drug versus all other drugs. When the ratio crosses a threshold, it triggers a signal.
When applied manually through quarterly batch reviews, these methods create three critical problems.
Small Numbers Produce False Alarms
ROR is extremely sensitive to sample size. Here’s what happens in practice:
- Week 1: Your database has three reports of Drug X causing dizziness. Background rate suggests 0.5 expected reports. ROR equals 6.0. Signal triggered.
- Week 4: You now have five reports with 0.8 expected. ROR equals 6.25. Signal strengthens.
- Week 8: Investigation reveals two reports were actually for a different drug with a similar name. ROR drops to 3.75.
You spent eight weeks investigating a data entry error. PRR creates the opposite problem, inflating signals for commonly reported events like nausea or headache and generating alerts that reviewers learn to ignore.
Uniform Reporting Does Not Exist
Both methods assume every drug and every adverse event gets reported consistently. Reality tells a different story:
- Cardiovascular drugs receive intense monitoring because heart-related events carry an immediate life-threatening risk. Cardiologists document every episode of chest pain, palpitations, or shortness of breath, even when causality seems unlikely.
- Dermatology drugs face lighter scrutiny because skin reactions are rarely fatal. Dermatologists often skip reporting mild rashes or dry skin unless the reaction becomes severe. This sparse reporting means your statistical method works with incomplete data from day one.
- Newly launched drugs attract disproportionate attention during their first two years on the market. Physicians report everything because they remain uncertain about the safety profile. This reporting spike artificially inflates signal detection for new drugs.
- Generic drugs available for decades see reporting rates drop significantly. Physicians assume we would know by now if there was a problem, so they skip reporting adverse events. Rare signals for established drugs remain invisible because nobody watches anymore.
When your detection method assumes uniform reporting but your data shows the opposite, you detect reporting biases rather than safety signals.
Research examining disproportionality analysis found that most organizations struggle with consistency. Analysis found that most organizations struggle to clearly define their case selection criteria, and many fail to document their signal thresholds. Different analysts running the same data produce different signals depending on the arbitrary choices they made that day.
Quarterly Reviews Create Detection Gaps
Most organizations run signal detection every three months through manual batch processing. Here’s what that timeline looks like:
- January 15: First adverse event report for Drug Y and liver enzyme elevation arrives
- February 3: Second case comes in
- February 28: Third case arrives
- March 15: Fourth case arrives
- April 1: Quarterly signal detection review runs. Signal detected.
- April 8: Medical review begins
Time from first case to detection: 12 weeks.
During those 12 weeks, your drug remained on the market with no warnings, no investigation, and no risk mitigation. Prescriptions continued. If that liver toxicity signal is real, dozens or hundreds of additional patients received exposure to a known risk before your safety team opened the first case file.
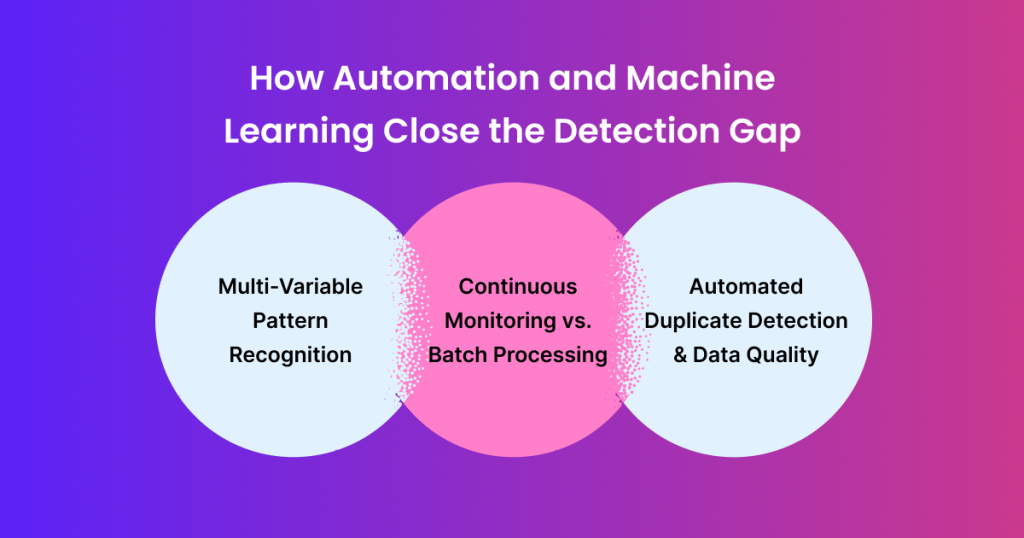
How Automation and Machine Learning Close the Detection Gap
Traditional manual methods ask whether a drug-event combination gets reported more often than expected. Automated systems powered by machine learning algorithms ask what patterns across patient age, gender, dosing, concomitant medications, event timing, and reporting source indicate a real safety signal.
Multi-Variable Pattern Recognition
Instead of calculating a single ratio manually, machine learning algorithms analyze dozens of variables simultaneously and automatically. A gradient boosting model might notice that liver enzyme elevations for Drug X occur primarily in:
- Patients over 60 years old
- Taking specific co-medications
- Within the first two weeks of treatment
That pattern, invisible to manual PRR/ROR analysis, becomes the signal. Studies using gradient boosting have achieved accuracy rates exceeding 90% in post-marketing surveillance, detecting signals weeks earlier than traditional quarterly reviews.
Continuous Monitoring vs. Batch Processing
Traditional manual signal detection waits for case accumulation, typically needing three to five reports minimum to reach statistical significance. If those cases arrive over several weeks, detection happens months after the first warning sign.
Automated systems monitor data continuously:
- Each new adverse event report gets analyzed immediately against historical patterns
- When the algorithm detects an emerging signal after the second or third case, it flags the pattern for human review
- No waiting for quarterly review cycles
Pharmaceutical companies using automated surveillance systems have reported detecting signals several weeks earlier than quarterly manual PRR/ROR reviews. For drugs with thousands of monthly prescriptions, those weeks represent thousands of additional patient exposures prevented.
Automated Duplicate Detection and Data Quality
Approximately 70% to 80% of adverse event information exists across multiple formats, creating duplicate reporting challenges:
- A patient reports persistent headaches during a follow-up visit. The physician submits a report.
- The same patient calls the manufacturer’s safety hotline. A second report gets created.
- The hospital discharge summary references the same event. A third entry appears.
- Identify duplicate case reports by matching patient demographics, event descriptions, and temporal patterns
- Flag inconsistencies in coded fields that manual reviewers might miss
- Continuously monitor data quality across the safety database
- Process volumes impossible for manual review while maintaining accuracy
Real-World Scale: The Uppsala Monitoring Centre’s vigiMatch
The Uppsala Monitoring Centre’s vigiMatch algorithm demonstrates what automated capability looks like at scale. Since 2014, it has processed massive volumes of report pairs to identify duplicate case reports. Duplicates occur when the same adverse event gets reported by both physician and patient, artificially inflating signal detection. vigiMatch handles this continuously, maintaining accuracy while processing volumes impossible for manual review. This represents a production pharmacovigilance infrastructure handling real regulatory obligations for multiple countries.
Automated Signal Detection Implementation: Quick Checklist + Notes
The biggest concern organizations have about implementing automation in pharmacovigilance is whether it will disrupt their existing systems and workflows. The reality is that effective automation should integrate with what you already have, not replace it.
Start with Your Existing Systems
- Most organizations run safety operations on platforms like Oracle Argus Safety or ArisGlobal
- These systems contain years of historical data and support critical regulatory processes
- Platforms like Clinevo Signal Detection connect directly to existing safety databases
- Automation pulls data in real time, applies machine learning algorithms, and routes results back into current workflows
- Your team continues working in familiar systems while automation handles repetitive detection and screening tasks
Start Small and Prove Value
- Choose one specific problem causing the most operational pain
- Common starting points include duplicate case detection, signal triage burden, or quarterly review backlogs
- Run a pilot with a single product or therapeutic area
- Compare automated signals against traditional manual methods using historical data
- Measure actual time savings, accuracy improvements, and reduction in manual work
Build Confidence Before Scaling
- Pilot results demonstrate measurable value to leadership
- Teams that will use the system daily gain confidence through hands-on experience
- Once you have documented results, scaling to additional products becomes straightforward
- Expanding to other processes follows the same proven approach
Address Data Quality Early
- Automated systems work best with clean, structured data
- Assess current data completeness before implementation
- Identify any gaps that need addressing
- Organizations with well-maintained safety databases see faster results
Even basic data cleanup efforts make a significant difference in automated detection performance and support overall quality management compliance
Measuring Return on Investment
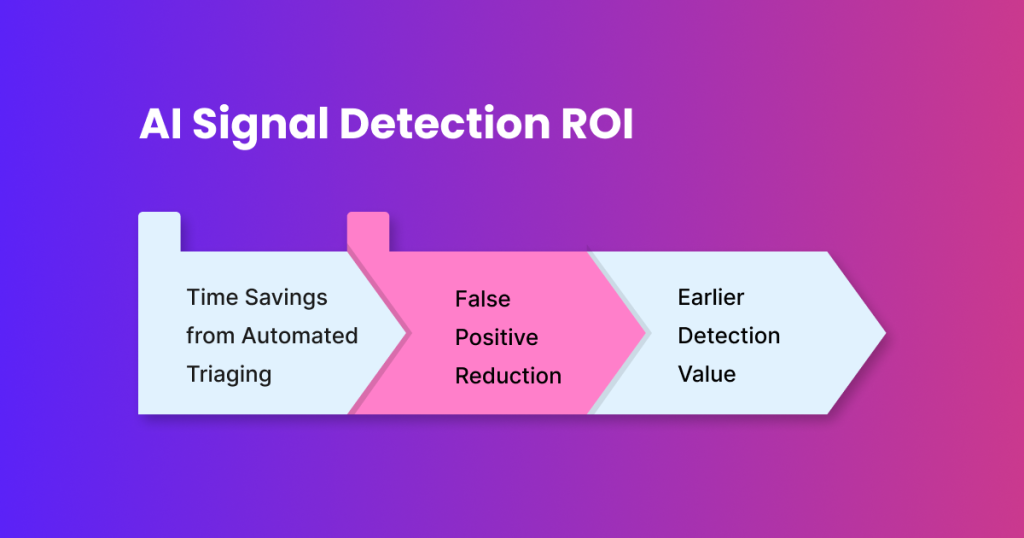
Return on investment manifests through time savings, earlier detection, and reduced false positives.
Time Savings from Automated Triaging
A safety team processing 500 monthly reports might spend:
- 40 hours reviewing all drug-event pairs for potential signals manually
- Another 30 hours investigating flagged combinations that prove nonsignificant upon detailed review
Automated triaging rules that immediately categorize routine cases can reclaim a significant portion of those hours monthly. Intelligent grouping of related cases—showing reviewers eight cases of Drug X plus rash together rather than scattered across 500 reports—accelerates pattern recognition. Organizations report substantial time reductions for signal triage when measured rigorously.
Earlier Detection Value
Earlier detection value depends on signal severity and market exposure. Identifying a hepatotoxicity signal weeks earlier for a drug with thousands of monthly prescriptions potentially prevents dozens to hundreds of additional exposures during that window.
False Positive Reduction
Machine learning models that reduce false positives eliminate dozens of unnecessary investigations quarterly. Each investigation requires several hours of medical review, literature searching, and documentation. That represents hundreds of hours annually for senior personnel to redirect toward genuine safety concerns.
Conclusion
Signal detection doesn’t have to rely on quarterly manual reviews and outdated statistical methods. Automated systems powered by machine learning algorithms enable continuous monitoring, multi-variable pattern recognition, and faster signal detection—all while integrating seamlessly with existing pharmacovigilance infrastructure.
Organizations that implement automation see measurable improvements in detection speed, investigation efficiency, and patient safety outcomes. The transition from manual to automated signal detection represents not just a technology upgrade, but a fundamental shift toward proactive risk management.

Frequently Asked Questions
Traditional manual methods often run in monthly or quarterly batches, requiring safety scientists to manually review data and calculate statistical measures. Automated systems monitor new cases continuously, apply machine learning algorithms in real time, and flag unusual patterns as soon as they emerge—often weeks earlier than manual batch reviews.
Regulators need to understand why a signal was flagged. Traditional manual methods show clear, transparent calculations that reviewers can audit step-by-step. Some machine learning models can be harder to explain because they weigh multiple variables simultaneously. That's why authorities expect strong documentation, validation studies, and the same rigorous medical review steps used for manually detected signals.
Yes, but integration quality matters. The automated system should be able to pull case data from existing tools like Oracle Argus Safety or ArisGlobal and push alerts back into the same workflow, so reviewers can act without switching platforms. Look for solutions designed specifically to work with industry-standard safety databases.
Machine learning algorithms require large volumes of clean, consistently coded data. Many teams have thousands of cases but struggle with:
- Inconsistent coding across different data entry personnel
- Missing or incomplete fields in historical records
- Variable narrative quality that makes pattern detection difficult
- Lack of standardized signal validation labels for training data
Organizations with well-maintained data dictionaries and coding standards see significantly better results from automation.
ROI typically comes from three sources:
- Faster triage: 40-60% reduction in time spent on routine signal screening
- Earlier risk detection: Signals detected 2-8 weeks earlier than manual quarterly reviews
- Fewer false positives: 30-50% reduction in unnecessary investigations
The best way to estimate ROI for your organization is through a pilot that measures time saved, detection speed improvement, and reduction in wasted investigation effort on false positives.