


The global spontaneous reporting system now spans databases of extraordinary scale. FAERS alone holds 31.8 million records,EudraVigilance contained over 29.3 million ICSRs as of early 2024,and in early 2025, WHO VigiBase crossed 40 million reports. FAERS alone receives over two million new adverse event and medication error reports every year.
Yet volume, in isolation, does not guarantee that every true signal surfaces in time. In 2025,EMA’s signal management team reviewed 1,201 potential safety signals across 995 active substances. Beyond data availability, the real challenge lies in whether a platform can extract genuine signals from the volume without generating a workload of false positives that consumes the time safety teams need for real investigation.
Most pharmacovigilance platforms approach drug safety signal detection through a narrow statistical lens: a standard disproportionality analysis run on spontaneous reports from a single database, queried at fixed intervals. This is a starting point, not a complete methodology. Signals that require cross-database context, temporal pattern analysis, or upstream data from case intake and literature review remain invisible to platforms not designed to integrate these inputs.
This article examines where conventional signal detection methods fall short, what the structural gaps look like at each stage of the signal lifecycle, and how the Clinevo Signal Management Platform is built to close them.
Why Traditional Signal Detection Methods Leave Gaps
Disproportionality analysis, including Proportional Reporting Ratio (PRR), Reporting Odds Ratio (ROR), and Bayesian methods such as EBGM, forms the foundation of quantitative signal detection. These methods are established, and regulators expect their use. The issue is not disproportionality analysis itself; it is the limitations that emerge when it is used as the sole detection method, applied without stratification, and run against a single data source.
The False Positive Problem
Research published on signal detection algorithm performance in FAERS found that the best-performing signal detection algorithms achieve an area under the curve (AUC) of 0.83, a figure that reflects meaningful predictive accuracy but also leaves a non-trivial proportion of statistical associations that are not genuine adverse drug reactions. Logistic regression-based approaches outperform standard disproportionality analysis, yet most commercial platforms have not moved beyond basic PRR and ROR thresholds.
A PMC study on statistical signal detection as a routine pharmacovigilance practice found that adjusting the case number threshold from N≥3 to N≥5 reduced the false positive signal workload by 13.8% with no loss of true signal detection. This points to a straightforward operational improvement that many platforms do not implement through automated threshold configuration.
A systematic review of 92 pharmacovigilance studies using disproportionality analysis found that multiple testing was not adequately addressed in the majority of publications, a methodological gap that contributes directly to false positive signal generation in practice.
Confounding by Indication and Competition Bias
Standard disproportionality analysis treats all drug-event pairs across a database as comparable, which they are not. A signal for a particular adverse event in an oncology product may reflect the background event rates of a severely ill patient population, not a drug-attributable risk. Running the same algorithm thresholds across oncology, cardiology, and primary care without disease-context adjustment produces meaningless comparisons.
Competition bias, where one drug with a large reporting volume suppresses the apparent signal of another, is equally well-documented. These forms of confounding are not edge cases; they are structural properties of spontaneous reporting databases that must be addressed in the platform design itself.
Single-Source Dependency
A platform that queries only one database misses the contextual signal evaluation that multi-source analysis provides. An emerging safety concern may appear in FAERS case reports while simultaneously showing up in published literature or within a company safety database, and the convergence of those signals across sources is often what allows a genuine drug-event association to be distinguished from a spurious statistical artefact.
Platforms that do not integrate FAERS, EudraVigilance, WHO VigiBase, and company safety databases into a unified detection layer are structurally limited to a partial view of the safety data landscape.
50
New molecular entities cleared by the FDA in 2024. Each approval extends a post-marketing surveillance obligation that the sponsoring organization must maintain indefinitely — expanding workloads without automatic increases in team capacity.
The Upstream Data Problem: Why Case Intake and Literature Monitoring Affect Signal Quality
Signal detection is only as good as the data feeding it. Two upstream inputs are often treated as separate workstreams when they are, in fact, directly connected to signal detection accuracy: case intake and literature monitoring.
Incomplete or Inaccurate Case Data Distorts Statistical Outputs
When adverse event cases enter the safety database with incomplete MedDRA coding, inconsistent seriousness classification, or duplicate records that have not been resolved, those errors compound in signal detection. A duplicate case inflates the reporting frequency for a drug-event combination. An inconsistently coded adverse event disperses reports across MedDRA preferred terms, reducing the apparent reporting rate and potentially suppressing a genuine signal below detection thresholds.
Improving signal detection accuracy is therefore partly an upstream problem. Automated case intake with intelligent pre-population, AI-driven duplicate detection, and real-time data quality validation at the point of entry reduces the structural noise before it reaches the signal detection layer.
Literature Monitoring as a Signal Input
A published case report of a drug-induced adverse event is a data point. If that case is identified through systematic literature monitoring and assessed as an ICSR, it enters the spontaneous reporting pool and contributes to signal detection. If it is missed, the signal detection database is running on incomplete data.
GVP Module VI requires systematic literature surveillance at a minimum weekly frequency, with documented search strategies and screening decisions. Non-compliance or incomplete surveillance not only creates a regulatory risk, but also creates a data gap in the signal detection input.
What this means in practice: A safety team monitoring a product for hepatotoxicity signals may have adequate FAERS data but be missing three published case reports in EMBASE that would, combined with the spontaneous reports, produce a statistically significant signal. In this scenario, the signal detection system is running on incomplete data.
Connecting literature surveillance directly to the signal detection workflow, so that validated literature ICSRs flow automatically into the detection database, is a vital requirement for complete signal detection.
What Advanced Drug Safety Signal Detection Actually Requires
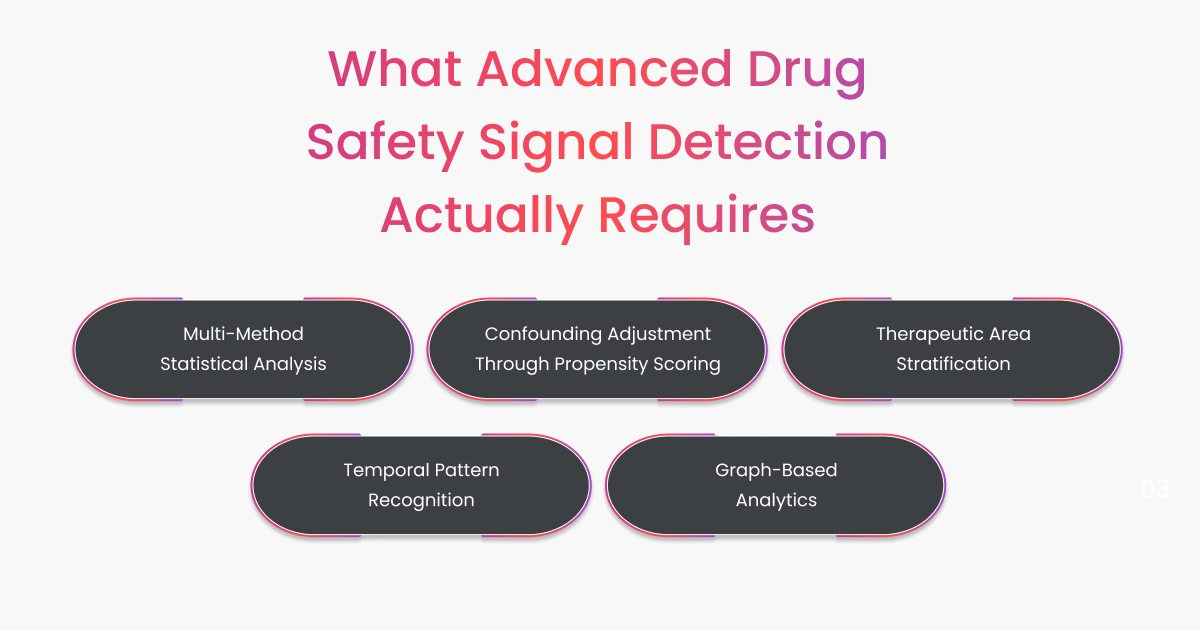
Moving beyond the limitations of single-method, single-source signal detection requires a platform built on several distinct technical capabilities. These are not incremental improvements to a standard disproportionality workflow; they represent a different approach to signal detection entirely.
Multi-Method Statistical Analysis
True quantitative signal detection uses multiple complementary statistical approaches simultaneously. Each method has sensitivity and specificity characteristics that differ by event type, drug class, and data volume. PRR performs well with common events in large databases. Bayesian methods such as EB05 and EBGM are better suited to sparse data where frequentist approaches produce unstable estimates. Chi-square analysis offers an additional confirmation layer. Running a single method in isolation means optimizing for a subset of cases.
Confounding Adjustment Through Propensity Scoring
Propensity score-adjusted algorithms address confounding by co-medication and underlying disease in a way that standard disproportionality analysis cannot. By adjusting for measurable confounders in the data, the statistical engine produces risk estimates for drug-event pairs that more accurately reflect drug-attributable risk rather than patient population characteristics.
Therapeutic Area Stratification
Performing signal algorithms within therapeutic area strata, rather than across the full database, limits inappropriate cross-area comparisons. An adverse event that is common in a specific patient population should not be evaluated against the overall background reporting rate across all drugs and all indications. Therapeutic area-specific algorithms, thresholds, and background event rates allow for statistically valid, clinically meaningful comparisons within the relevant context.
Temporal Pattern Recognition
Signal detection that runs only on cumulative case counts misses patterns that emerge across time periods. Seasonal clustering of certain adverse events, a spike in reports following label changes, or an emerging pattern concentrated in a specific demographic subgroup may each represent actionable safety information that cumulative disproportionality analysis alone does not surface.
Graph-Based Analytics
Modeling drugs, adverse events, patients, and risk factors as an interconnected network rather than a flat reporting table enables the detection of hidden relationships and cross-product signals that table-based analysis misses. Each detected signal can be traced along graph paths, supporting transparent, regulator-ready explanations of the data behind a signal assessment.
Traditional vs. Advanced Signal Detection: A Structural Comparison
| Signal Detection Dimension | Standard Platform Approach | Clinevo Signal Management Platform |
|---|---|---|
| Statistical Methods | Single disproportionality method (typically PRR or ROR) | Multidimensional: PRR, ROR, EB05, EBGM, Chi-square, propensity score-adjusted algorithms running concurrently |
| Confounding Control | ✗ Not addressed; indication and competition bias affect outputs | ✓ Automated threshold mapping with propensity score adjustment |
| Therapeutic Area Stratification | ✗ Algorithms run across the full database without clinical context | ✓ Disease-context-aware detection with area-specific thresholds and background event rates |
| Temporal Pattern Recognition | ▶ Cumulative case counts only; no time-series signal analysis | ✓ Automated trend analysis identifying emerging adverse event clusters across time periods and demographic segments |
| Data Sources | Usually, a single spontaneous reporting database | FAERS, EVDAS, WHO VigiBase, and any internal safety database through intelligent data fusion |
| Graph-Based Analytics | ✗ Table-based reporting only | ✓ Drug-event-patient-risk factor network modelling with traceable signal pathways |
| Signal Investigation Time | Typically, 2 to 3 weeks per signal | Reduced to 2 to 3 days through automated assessment and AI-guided prioritization |
| Literature Integration | ▶ Separate process; manual handoff into signal database | ✓ Direct integration with Literature Management platform; validated ICSRs flow automatically into signal detection |
| Report Generation | Manual narrative drafting by the PV team | Automated signal assessment report generation with evidence-based reasoning; report writing time reduced by 75% |
| Signal Explainability | Statistical output without data lineage | Every signal traceable along graph paths to source cases, patients, publications, and databases |
How the Clinevo Signal Management Platform Is Built Differently
The Clinevo Signal Management Platform is an automation-driven signal detection and assessment system designed for pharmacovigilance operations at scale. Its architecture addresses the structural gaps in conventional signal detection rather than adding layers on top of them.
| Technical Multi-Method Statistical Detection | PRR, ROR, EB05, EBGM, and Chi-square analytics run concurrently across the full case dataset. The system identifies safety signals 2 to 3 weeks earlier than platforms relying on a single statistical method. |
| Technical Propensity Score-Adjusted Thresholds | Automated threshold mapping with propensity score adjustment reduces confounding by indication and co-medication. Signal specificity improves by 40%, lowering the false positive rate across large-scale automated screening. |
| Technical Graph-Based Signal Analytics | Drugs, adverse events, patients, and risk factors are modelled as an interconnected network. Hidden and cross-product signals visible only through relationship analysis are surfaced automatically. Every detected signal is traceable along graph paths for regulatory transparency. |
| Technical Temporal Pattern Recognition | Automated trend analysis identifies emerging adverse event clusters across time periods and demographic segments with 98% sensitivity. Seasonal patterns and post-launch spikes are detected rather than appearing only in periodic cumulative analysis. |
| Technical Multi-Source Data Fusion | Direct integration with FAERS, EVDAS, WHO VigiBase, and internal safety databases through database-to-database linking technology. Signal evaluation draws on regulatory and non-regulatory sources simultaneously without compromising data governance. |
| Operational Therapeutic Area-Based Signalling | Signal algorithms operate within disease-context-aware strata. Oncology, cardiology, and other therapeutic areas each have tailored thresholds, covariates, and background event rates. Cross-area comparisons that introduce noise are structurally suppressed. |
| Operational Automated Signal Assessment Workflow | Automated validation workflows with AI-guided prioritization of investigation priorities reduce signal investigation time from 2 to 3 weeks to 2 to 3 days. Signal assessment reports are generated automatically with evidence-based reasoning. |
| Operational Predictive Signal Severity Assessment | The platform estimates the potential impact and urgency of detected signals before human investigation begins. Priority cases requiring rapid regulatory communication are identified automatically rather than surfacing only after manual review. |
| Operational Real-Time Signal Dashboard | Dynamic visualisations and trend forecasting provide continuous monitoring across the product portfolio. Emerging safety concerns are visible as they develop rather than in quarterly reporting cycles. |
On integration: The Clinevo Signal Management Platform connects directly with Clinevo’s Case Intake and Literature Management platforms via secure API. Validated case data and literature ICSRs flow into the signal detection layer without manual reconciliation, eliminating the data gaps that fragmented PV systems create between upstream processing and downstream signal analysis.
What Signal Detection Looks Like as an Integrated Workflow
The benefits of a technically advanced signal detection platform are substantially reduced when it operates in isolation. A platform that detects signals with high accuracy but receives fragmented, manually reconciled data from disconnected case intake and literature systems will still produce a compromised signal dataset. In a connected pharmacovigilance workflow:
- Adverse event cases processed through automated intake, with real-time duplicate resolution and data quality validation, enter the safety database clean and fully coded.
- Literature surveillance identifies and assesses case reports in published scientific journals. Validated ICSRs are transferred directly into the safety database through API-based integration, with E2B R3-compliant case records and complete audit trails.
- The signal detection platform queries this consolidated, multi-source dataset using multidimensional statistical methods, applying therapeutic area stratification and temporal pattern analysis across the full case history.
- Detected signals trigger automated assessment workflows, with AI-guided prioritization ensuring that the highest-impact cases reach pharmacovigilance reviewers first.
- Signal assessment reports are generated automatically, with evidence-based reasoning drawn from the underlying case data, literature sources, and multi-database context.
Each stage in this workflow feeds the next. Signal detection accuracy depends on the completeness of what enters the safety database. Investigation efficiency depends on the quality of automated signal assessment. Regulatory credibility depends on the transparency and traceability of every step.
Platforms that handle signal detection only, without connecting to structured case intake and literature automation, are operating at a structural disadvantage regardless of their statistical sophistication.